“Long tail”, or slow-moving products, are inventory items with a low turnover. Long-tail products are a common in many real-world demand distributions and in recent years has received considerable attention from business and the research community. A classical example of this phenomenon can be observed in the distribution of Book Sales data. A small subset of books (New York Times best sellers) enjoy an enormous amount of popularity whereas a large number of obscure books (for instance graduate level textbooks), though essential, barely register in the sales figures.

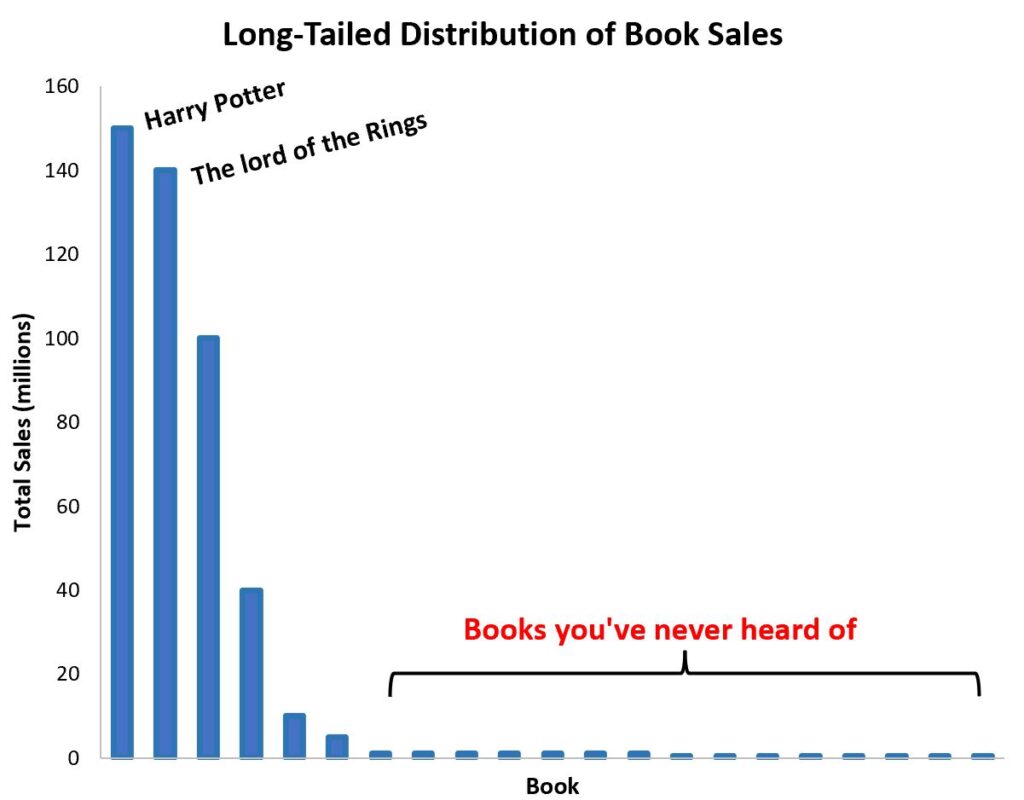
Book Sales data show that some books are enormously popular than others
In specific cases, such as Aircraft Maintenance and Automotive industries, the long-tail products (which usually include critical spare parts) occupy the bulk of the operational costs and revenues of a firm. Surveys show that at an automotive aftermarket spare parts business, the long tail products contribute to 98% of SKU’s and nearly 62% of the revenues. In the book “The Long Tail” Chris Anderson argues that as the consumer behaviour evolves towards unique tastes and products catering to the discerning consumer, the long tail products collectively create a new market as big as the ones in the head of the demand curve.
“The Long Tail” is a powerful new force in our economy: the rise of the niche. As the cost of reaching consumers drops dramatically, our markets are shifting from a one-size-fits-all model of mass appeal to one of unlimited variety for unique tastes.”
“The Long Tail” – Chris Anderson
Since such products exhibit sparse and intermittent demand, an inventory manager has a huge headache in managing them, particularly when they are expected to deliver on the “fill-rate” targets with limited warehouse capacities. Numerous good Inventory management policies exist for popular products. For instance a Constant Base Stock (CBS) policy is one wherein the manager ensures that the warehouse maintains a minimum inventory and replenishes whenever stock goes below the threshold, in a timely manner. However, maintaining inventory when product demand is intermittent, results in over-utilizing warehouse space for products that do not move quickly. This problem escalates when the number of SKU’s increase, as in the case of the Automotive spare parts industry.
The reason why an inventory manager might choose a CBS policy for a product in the ‘long-tail’ is due to the belief that once a product gets sold, the safe choice to hit their “fill-rate” KPI’s is to replenish asap. This is a reaction to a well-known phenomenon called the “Gamblers Fallacy” which is an incorrect belief that “if a particular event occurs more frequently than normal during the past, it is less likely to happen in the future”. However, numerous empirical studies show that, for long-tail products the fallacy actually holds true i.e. the likelihood of having another demand occurring shortly after the preceding one is indeed much lower.

Slower replenishment has the benefit of freeing up warehouse space (reduce inventory holding costs, free up cash flow etc.) with a slight risk to the fill-rate target which can be mitigated by the inventory manager by carefully controlling the ordering policy i.e. deciding when and how much to Replenish!
This precise set of queries are raised in the study “Taming the Long Tail: The Gambler’s Fallacy in Intermittent Demand Management” by Bi et. al. In this work, they propose an alternate to the CBS called the Staggered Base-Stock (SBS) policy that is effective for products with intermittent demand. The essence of the SBS is to slowly build up the inventory for such products over a period of time instead of immediate replenishment.
The authors show with numerous experiments and analysis that by carefully staggering the replenishment, the inventory manager can not only achieve the “fill-rate” targets with reduced inventory cost, but by doing so, they can have a positive impact on other business metrics such as average cost per cycle (the average cost during a cycle between two consecutive events) and EBITDA margin (the Earnings Before Interest, Tax, Depreciation, and Amortization percentage of total revenue).