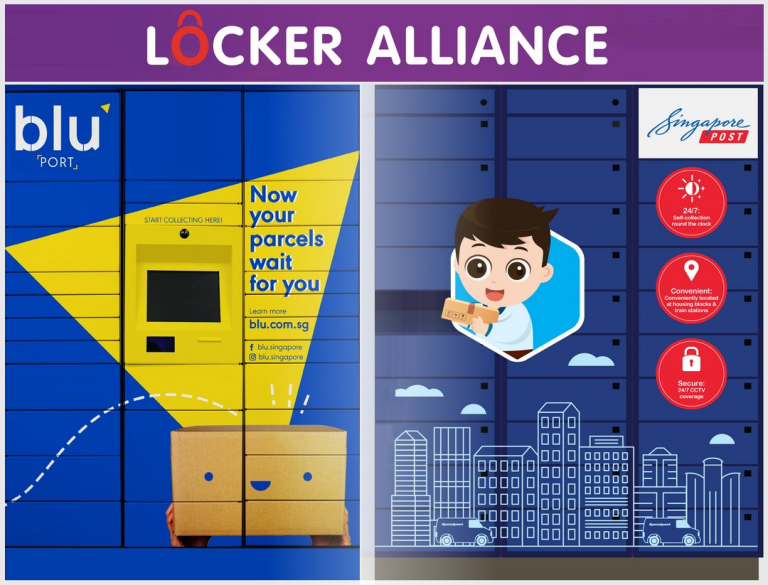
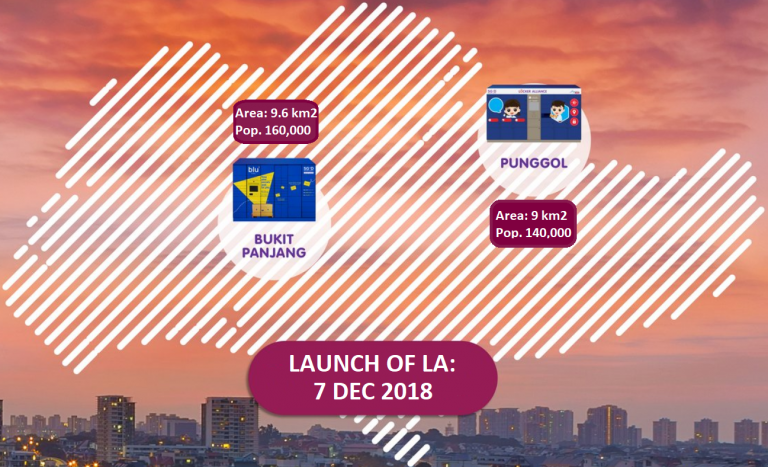
We began a partnership with the Infocomm Media Development Authority of Singapore (IMDA) in Dec 2018, to use analytics and help them evaluate the Locker Alliance pilot they launched in Bukit Panjang and Punggol.
The Locker Alliance is an interoperable network of parcel lockers located in residential areas and train stations, that aims to improve the efficiency of last mile parcel delivery operations.
We saw this as an opportunity to participate in the testing and implementation of a successful technology that has the potential to change and improve the last-mile delivery in Singapore. Our aim in this project was to answer three main questions:
How much customers value the pick-up options at the parcel lockers?
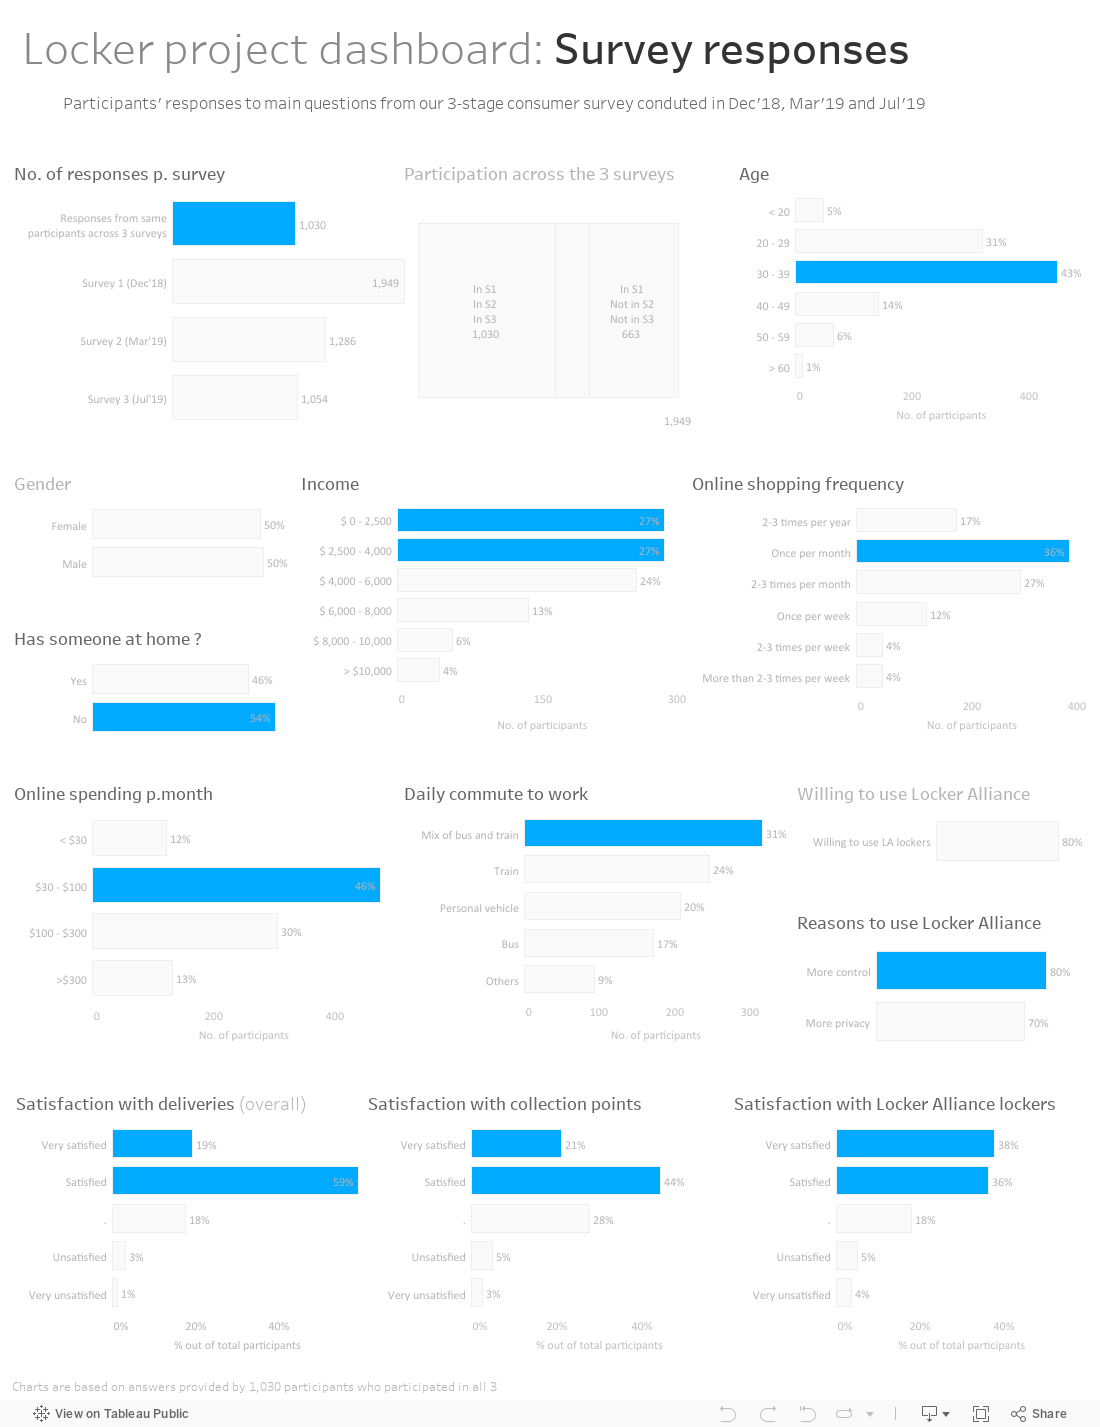
We conducted a survey to understand consumers’ attitude towards delivery to lockers and their shopping behavior. We surveyed 1,030 participants across three stages from Bukit Panjang and Punggol, the towns where the Locker Alliance pilot was launched. The first survey took place before the launch of the pilot in early December 2018. The second survey took place in March 2019 and the last one in July 2019. We used an interactive dashboard to summarize the responses of the survey participants to the main questions in the survey. You can find the dashboard in the section below.
What is the impact of LA system on Singapore urban logistics ecosystem?
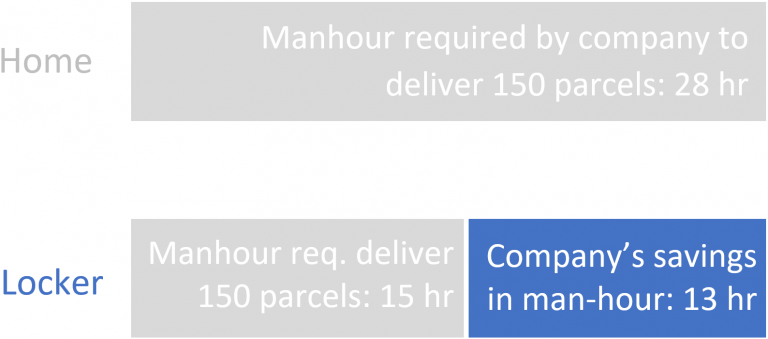
Using data from IMDA and delivery companies again we determined that deliveries in Punggol and Bt Panjang have become more efficient since the launch of the Locker Alliance pilot in Dec 2018. It takes less time for a courier to deliver a parcel to lockers compared to homes. Couriers can deliver 11 parcels per hour to Locker Alliance lockers but only 5 parcels to home. And, the number of parcels delivered to the Locker Alliance per hour increased from around 8 parcels in Dec 2018 to 13 parcels up to Jul 2019.
We have recapped the results of these and other studies below. We are unable to share the results of all of them because of the confidentiality of the data.
Consumer Survey
Tableau Dashboard Demo
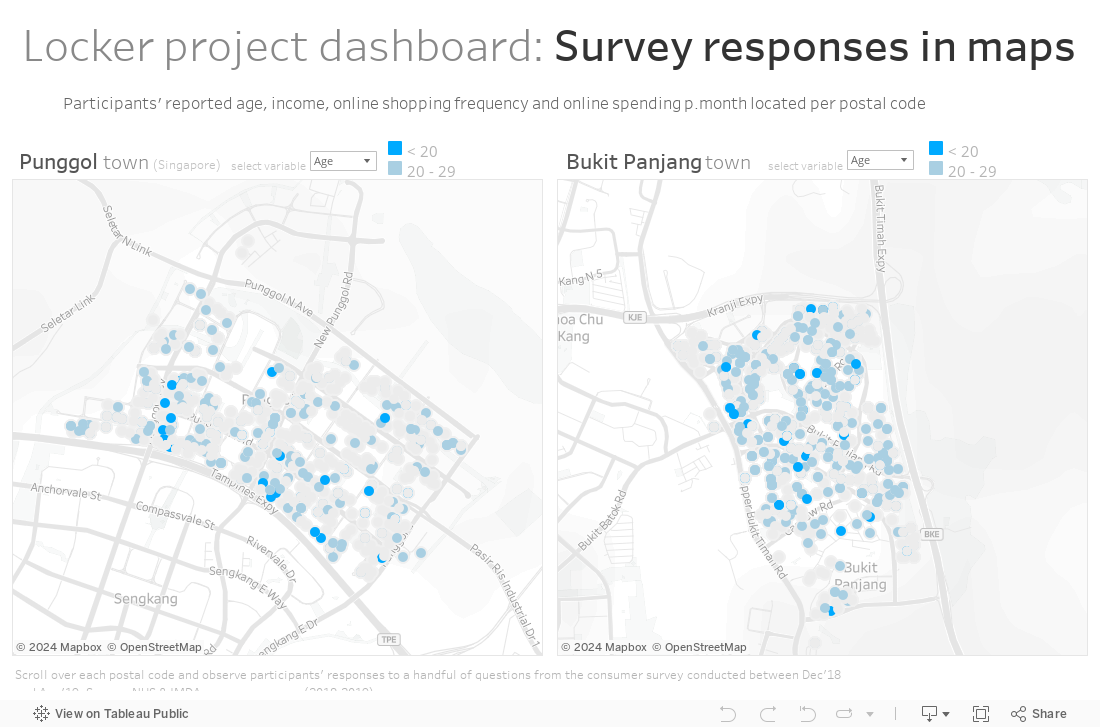
You can observe the difference in basic demographics and shopping behavior between survey participants from Bukit Panjang and Punggol by comparing the two maps below. We used an interactive dashboard again to plott survey participants’ responses based on their stated residential location.
Tableau Dashboard Demo
Locker demand model
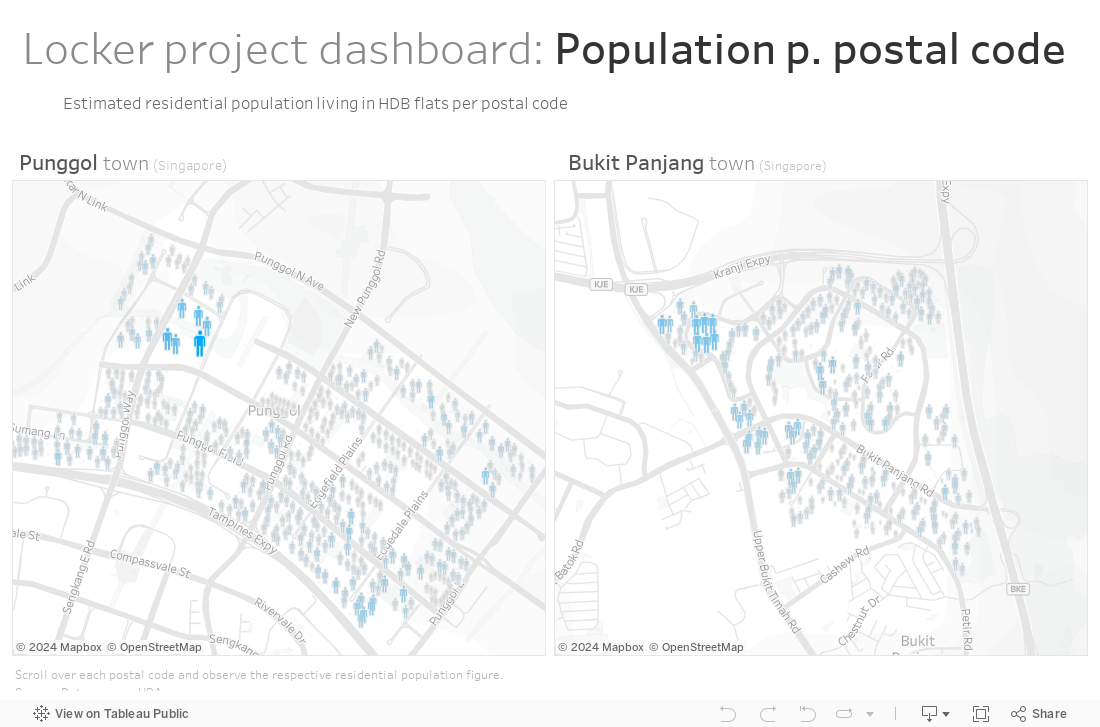
We built a multinomial logit model to predict parcel volume per locker stations. We used both public and confidential data. We are unable to share the results of the model here due to confidentiality issues. The resident population per postal code is one of the public datasets we used. We used an interactive dashboard to plot this data in a map.
Tableau Dashboard Demo
Increase in productivity and savings
We used data from a delivery company and from the Locker Alliance pilot to evaluate how much delivering to lockers increases the productivity of couriers when compared to using home delivery. And, how much this means in cost savings. Below you can find some of the main findings from our analysis. We are unable to share all the specifics and most of the results due to confidentiality.
Delivery company savings in man-hours due to lockers
Delivery company increase in productivity per man-hour due to lockers
Delivery company savings in distance travelled due to lockers
Delivery company savings in cost of delivery per parcel due to lockers